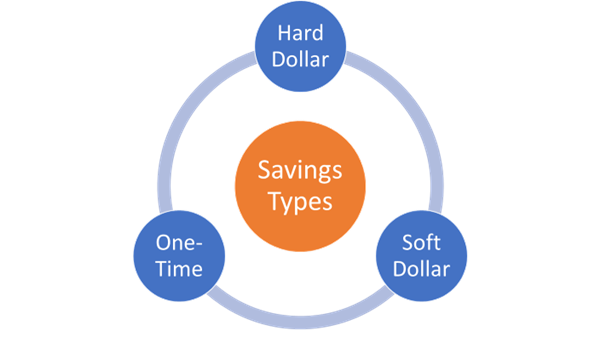
With more challenging times in our hospital supply chain world, we are more attuned to saving money than we have been for quite some time. With this comes the ever-present savings reports from supply chain and value analysis teams that represent the total savings for that particular fiscal year. This is a model that just about every organization follows. This is a best practice that really gives you a true measure of your activity related to saving money.
Hospital Supply Chain Leaders Agree That the Numbers on Savings Reports Must Actually Be Hitting Your Bottom Line
As a Vice President of Supply Chain once said to me, “We are highly reliant on the savings in the savings reports that my teams generate in order to hold the line on a solid bottom line for our organization.” Most of your supply chain and financial leaders will agree that these are not just numbers on an Excel spreadsheet but a vital component of supply chain’s operational excellence. The most important part of the savings reporting process is that you are reporting true savings that are actually hitting your bottom line. In order to do this, you must first understand the benchmarks for savings that will help you define and fine tune your own savings reporting.
Traditional Savings Model

Hard Dollar Savings – This is simple. Things that can be mathematically proven are hard dollars savings. Price (i.e., garnering a lower price) is the simplest example of this. There are other ways to show savings with key performance indicators and/or benchmarks, such as, your average cost per CRM ICD/defib implant has been reduced by 33% from the previous year. Or, your robotic cost per robotic case has decreased from $2,100 to $1,300. These are easily proven and should be in your savings report that you share with your CFO and or supply chain leadership.
One-Time Savings – These are savings that occur when you make a one-time change, like reducing product categories’ inventory levels from $125K in all of your health system’s storeroom inventories to $55K. This is something that perhaps you could be reporting out when you can prove it, however, I often look at the entire category of purchase to see if, for example, the cost per adjusted patient day has decreased overall. Just reducing inventory levels does not really affect how much you spend. You have to be careful with this one, otherwise you are reporting out a false positive.
Rebates – The high volume in rebates and administrative fees from the group purchasing organizations that every health system belongs to and the fact that you receive actual checks back every quarter/year is great. Some organizations actually budget out what they will receive from their rebates and administrative fees in order to make sure they are accounting for these in their supply and service budgets. Are these really new savings that you receive every year? If your rebates/admin fees were $3.2 million last year and this year they are $3.6 million, wouldn’t the net effect come into play and your true savings for your new fiscal year be $400K? Since rebates are part of the game, are we truly doing anyone any good by reporting out $3.6 million in new savings when in fact it has been relatively the same and you only should be showing the increase/decrease effect?
Cost Avoidance – Value analysis savings are full of cost avoidance as they prevent high-cost products from entering the supply chain, thus adding to the organization’s bottom line. If you are tracking cost avoidance in a VA setting, then you should also be tracking your increases along with your price savings. For instance, we have a few systems that track everything in a net savings format, meaning that they track the increases, decreases, and the cost avoidance in one net savings figure. This works well and gives a true number in the cost/increase bucket.
Capital savings would also fall into your cost avoidance bucket. For instance, if you somehow find a lower cost price or reduce features of a product to lower the acquisition cost of said product, then you will in effect avoid paying the added costs. Since you have not spent any money with your budget dollars this can only be set out as cost avoidance in the scope of savings reporting.
Soft Dollar Savings – These are the savings that I really don’t bother with, nor do I believe you should be wasting your time on. I remember when a copier company did an analysis on a community hospital for a cost per click copier contract which stated that they could save the organization $930K annually. My first reaction to the sale rep was, “You know, they only spend $300K annually on their copiers, service, and supplies.” They added in an additional $700K in “productivity savings” that they said they would give back to the organization with an organized and engineered copier workflow. This is a perfect example of soft savings that had to be ignored as fluff.
Savings Opportunities Must Be Provable and Sustainable for Your Hospital Supply Chain to Succeed
As an outsider working for my clients throughout the country in new and different areas of clinical supply utilization, consumption management, and savings validation, I have learned that there is a fine line of what they will accept and not accept as far as savings goes. It is even more difficult as an outsider but not impossible as long as the savings opportunities are provable and sustainable not only in the short term but also over the long term. I hope this helps you button up what you define as savings to gain that next level of sustainability for your healthcare organization.
Below are some similar articles that you may find interesting.
3 Strategies to Reduce Burnout for You and Your Hospital Value Analysis Teams
